The NASA IBM lunar AI model, officially the NASA-IBM Lunar Foundation Model, is an open-source AI system that helps scientists analyse large sets of Moon observations. It was released on September 10, 2026. Researchers can fine-tune it to map craters, outline young volcanic features and estimate where ice may be stable near the lunar poles. The model weights are free to download, and the code is public.
This article explains what the model was trained on, the reported results and the limits its developers set out. That last point matters: a model that is good at finding patterns has not, by itself, found water on the Moon.
What NASA and IBM released in the lunar model
NASA’s announcement calls it among the first open-source AI models built specifically for lunar science. The model is hosted on Hugging Face under the Apache-2.0 licence, with its full codebase on GitHub. The team also released machine-learning-ready training data and benchmark sets, and made the model work with IBM’s open-source TerraTorch toolkit.
A foundation model is pre-trained on large amounts of unlabelled data. It can then be adapted to a specific job with a small number of labelled examples. That suits lunar science, where imagery is plentiful but expert labels such as hand-mapped craters are scarce and slow to produce.
Seventeen years of orbiter data behind it
Most of the training data comes from NASA’s Lunar Reconnaissance Orbiter (LRO), which has observed the Moon for about 17 years. NASA says LRO has produced more data than all of its other planetary missions combined. The model was trained on roughly 2 million image tiles: just over 1 million high-resolution camera images at about 1 metre per pixel and nearly 964,000 multispectral images at 100 metres per pixel.
Data from NASA’s GRAIL and Lunar Prospector missions and Japan’s SELENE (Kaguya) probe was added to the LRO imagery. IBM’s release says the combined dataset aligns more than 30 data layers from nine instruments on four missions.
One design choice stands out. On the Moon, lighting has a bigger effect on how the surface looks than the surface itself does. So for each tile, the model is given the sun angle and viewing geometry as an input instead of having to infer them from pixels. The Decoder’s October 4 analysis describes this as one reason for the model’s performance.
Craters, volcanic patches and polar ice
NASA says the model “matched or exceeded” several strong baseline models on every task it was tested on:
- Polar ice prospectivity: the clearest gain. IBM says the model reduced prediction error (RMSE) by up to 22% compared with SwinV2-B, a widely used image model.
- Crater detection: at roughly 100-metre resolution, IBM reports a lead of nearly 19% over SwinV2-B while using half the training data. At metre scale, the results were comparable.
- Irregular mare patches: these unusual volcanic features look young enough to challenge accepted timelines for how the Moon cooled. IBM reports a 3% edge, which the model card says is within normal run-to-run variation.
NASA also showed that a fine-tuned version could flag a fresh crater created when a spent SpaceX rocket body hit the Moon near Einstein crater. The post-impact image had been left out of pre-training. Approaches like this could help scientists detect new impacts and other surface changes automatically, though NASA notes that differences in lighting between orbits can affect how visible small craters are.
Reading the 22% figure correctly
The 22% figure refers to lower error on a single benchmark task. It does not mean the Moon has 22% more ice than thought, or that every map the model produces is 22% more accurate. The model card on Hugging Face goes further: the ice outputs predict a “knowledge-driven” prospectivity map, “not measured ice.” In other words, they point to places worth investigating, not to a confirmed resource.
The developers list other limits as well:
- The model is “not validated for operational decisions such as landing-site certification or hazard clearance.”
- Its generated outputs are not calibrated measurements. In tests, generated latitude and longitude values were sometimes off by tens of degrees.
- Experiments that would isolate the contribution of each design choice have not yet been run, and some test sets are small.
Part of the advantage may come from the model’s structure rather than its lunar training. The Decoder notes that an untrained version with the same architecture still beat most baselines on ice prediction.
Why the open NASA IBM lunar model matters
Because the weights, code and benchmarks are public, other researchers can rerun the results, test the model on their own regions and adapt it to new questions. They do not have to rely on the launch figures alone. The Hugging Face page recorded 2,359 downloads in the past month when we checked on October 27, 2026. Downloads are not the same as published research, but they show early interest.
The release continues a collaboration that began under a NASA-IBM Space Act Agreement in early 2022. That work also produced the Prithvi Earth-observation models and the Surya model for solar physics. Open weights let anyone run and modify a model, a theme also covered in our report on PewDiePie’s home-PC Ajax model.
Links to Artemis
Better maps of shadowed polar terrain and crater hazards are directly useful as agencies plan more missions to the lunar south pole. The model does not replace landing-site surveys, but it can help scientists decide where to look first. For the human-mission timeline, see our report on Artemis III and the planned 2028 Moon landing, or browse more technology reports.
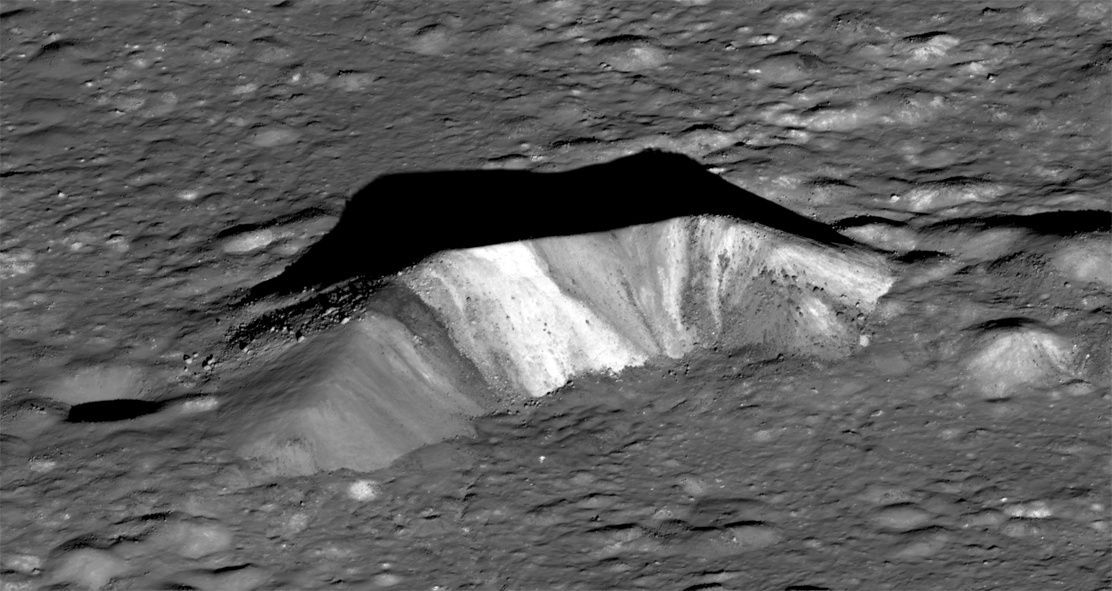
Featured image: NASA/GSFC/Arizona State University, Lunar Reconnaissance Orbiter. Public domain via Wikimedia Commons.